The report builder
Drag blocks onto a twelve column grid, pick a measure and a dimension, and watch each block redraw. Publish when it is right, so a half finished edit is never what a teammate opens.
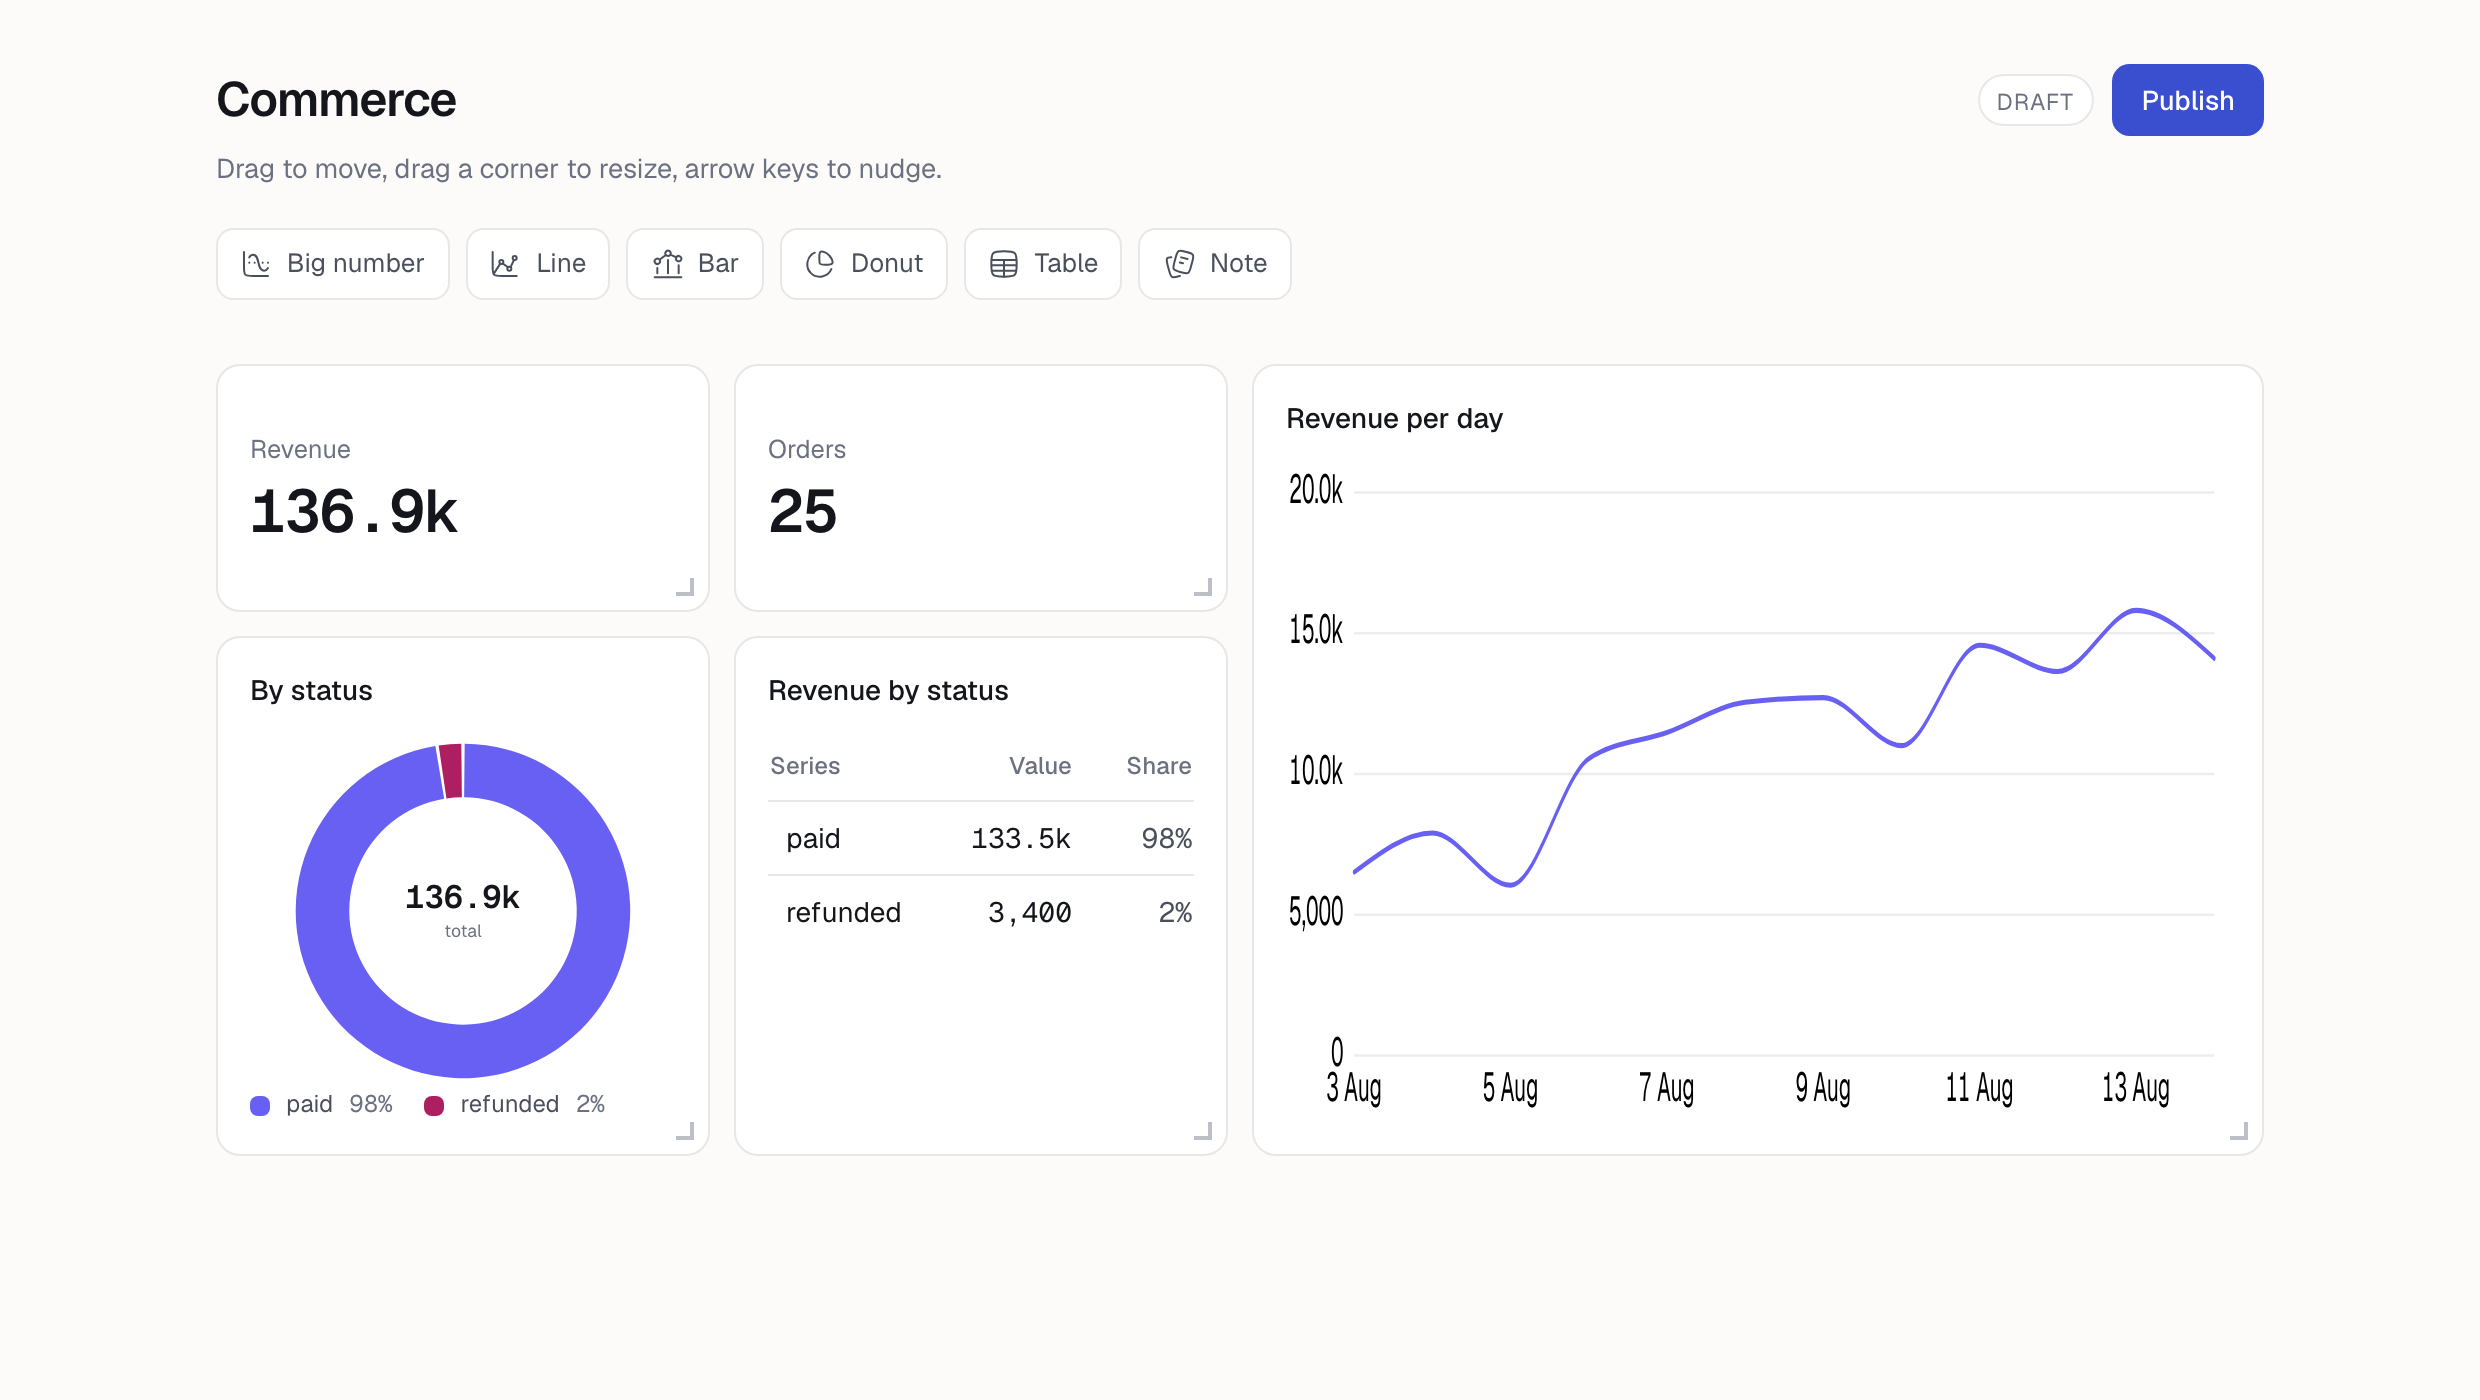
Blocks on a twelve column grid
Drag to move, drag a corner to resize, arrow keys to nudge. Everything below what you moved gets out of the way by the full height of what displaced it, so a grid never ends up with a block sitting inside another one.
The server decides what a drag meant
The browser packs the grid so the drag feels immediate, and the server packs it again for the record. The response carries the canonical positions back. That way what is stored and what you saw cannot drift apart, which is the failure that makes a builder feel haunted.
Each block is a question
Pick a measure, a dimension and a time grain. The choices come from the models you described, so the panel cannot offer a field the query would then refuse.
A refusal beats a wrong number
Ask something the data cannot answer honestly and the block says so on its face. A revenue-per-product chart that would count an order once per line item is refused rather than drawn, because a plausible wrong number is worse than an empty tile.
Publish when it is right
A draft is yours until you publish it. Nobody opens a half arranged grid, and a share link never serves one.
Try it on your own events
The free plan carries a real month of a small project's events, and the builder is the same one on every tier.
Start free